Creating a data strategy
National Australia Bank (NAB) • Investment Banking • Markets and Treasury Finance
The starting situation
- No proper data strategy in place regarding the use of Business Intelligence, master data management, self-service analytics, etc.
- Most of the internal reports (e.g. reconciliations spreadsheets, Profits and Loss, traders’ sign-off, etc.) were produced in Excel with extensive use of VLOOKUP-like formulas, unnecessary manual interventions and outdated VBA macros (no expertise in coding/development).
- Some spreadsheets were also converted into PDFs and PPTs, annihilating any sort of data analysis.
- There were no centralised way of disseminating data throughout the finance department. People were relying on SharePoint drives and were receiving 100+ emails per day.
- Most of the reports were sent on a daily basis, with CSV or XLSX files attached. Some were inaccurate and only contained screenshots of Excel tables.
- The email was used as a one-size-fits-all solution.
About National Australia Bank (NAB)
NAB serves the financial needs of
their Australian, New Zealand and global customers.
NAB's workforce is made up of more than 38,000 colleagues globally, supporting more
than eight and a half million customers in Australia and overseas across: personal
accounts, small, medium and large businesses, private clients, government and
institutional activities.
Solution
- I collaborated with various departments (finance, IT) to identify all the stakeholders involved and the required/existing data sources.
- I requested the implementation of a Power BI Server, so that we could streamline and automate reports. It would become the main point of entry/portal for all finance reportings.
- In some cases, dedicated workflows had to be developed in Python (prototyping using Jupyter Notebook) before generating proper visualisations in Power BI.
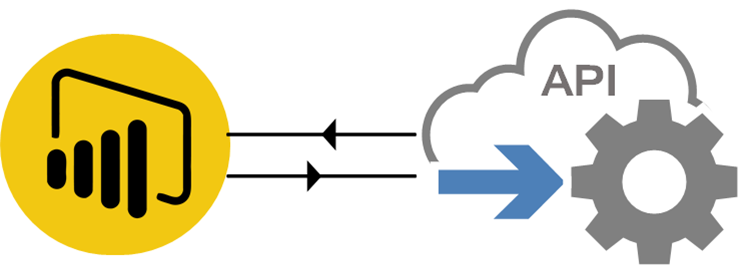
- Strengthening and enhancing already existing APIs.
- Data governance also had to be enforced. Some of those reports were sent out to a large audience, which did not necessarily need access to it (leveraging groups in SailPoint).
- Emails should be used to disseminate relevant and important information. It should not be used as a log monitoring tool.
Connecting to APIs with Power BI
Outcome
- Creation of customised, state-of-the-art dashboards (e.g. Profit and Loss dashboard with drilling capabilities, period-over-period analysis, self-service analytics) for each and every team.
- Implementation of fully automated dashboards (sourcing data from data lakes, data warehouses, APIs, etc. rather than manual mappings stored on shared drives).
- Improved data governance: new SailPoint groups (Identity management tool) to limit access to certain Power BI folders and dashboards.
- Development of data completeness dashboard (identifying when reports are ready for consumption, identifying bottlenecks in the data sourcing, etc.).
- Monitoring usage metrics in workspaces (identifying popular dashboards, features, etc.).
- The CFO, executive general managers and finance partners can now attend a meeting with a dynamic tool allowing them to deliver storytelling. They can answer questions on-the-fly by drilling into the visualisations.
Takeaways
- Change management skills required: it takes time for people to adapt to new ways of doing things (even though the new tools may make a lot of sense on the paper)
- Upskilling/training sessions were required so that end-users could fully embrace the new BI solutions.